Utility of cardiodiagnostic aids
By: Andrés Posada Romero, general practitioner.
Enlace Clínico, Laboratorio Clínico Hematológico.
Published: August 15, 2023
Our body is composed of millions of cells that require oxygen and essential nutrients, such as sugars and proteins, to obtain energy and function properly. These substances are found in the blood and are distributed throughout the body via the cardiocirculatory system. The heart acts as the pump that propels the blood to circulate through the veins and arteries, and is made up of four chambers or cavities: two atria (upper) and two ventricles (lower) (1).
When the blood has transferred oxygen, proteins and sugars to the body's cells, it returns to the heart through the veins into the right atrium. It then passes through the tricuspid valve into the right ventricle. From there, the blood is sent to the lungs through the pulmonary artery to incorporate the oxygen taken in by breathing. After oxygenation, the blood returns to the heart through the pulmonary veins to the left atrium, passes through the mitral valve and reaches the left ventricle, from where it is propelled to the aorta to be distributed (1).
The assessment of heart health and the detection of possible irregularities are supported by various biomedical tools. In this text, we will discuss some of the main diagnostic aids that provide key information on heart rhythm, electrical activity or cardiac function for the diagnosis and monitoring of some cardiovascular diseases.
Electrocardiogram.
An electrocardiogram (abbreviated as EKG or ECG) is a test that records the electrical activity of the heart. Each heartbeat generates an electrical impulse or wave that travels through the heart, causing it to contract and pump blood. The normal heartbeat on ECG shows the synchronization of the upper (atria) and lower (ventricles) chambers ( 2,3).
The ECG records the electrical activity of the heart by placing electrodes on the patient's skin, which are connected to the electrocardiograph. This device displays the different waves representative of the electrical stimuli of the atria and ventricles. To obtain the graphic representation of the electrical activity, 10 electrodes are used to generate 12 leads, which allows obtaining 12 tracings of the heart's electrical impulses from different points of the body (4).
The contraction of the right and left atria is reflected in the first wave of the electrocardiogram, known as the "P wave". This is followed by a straight line (isoelectric) indicating that the electrical impulse was transmitted to the ventricles (PR segment). Then, the next wave appears, called the "QRS complex", which represents the contraction of the right and left ventricles. The final wave or "T wave" reflects the electrical recovery or return of the ventricles to a resting state (2,3).
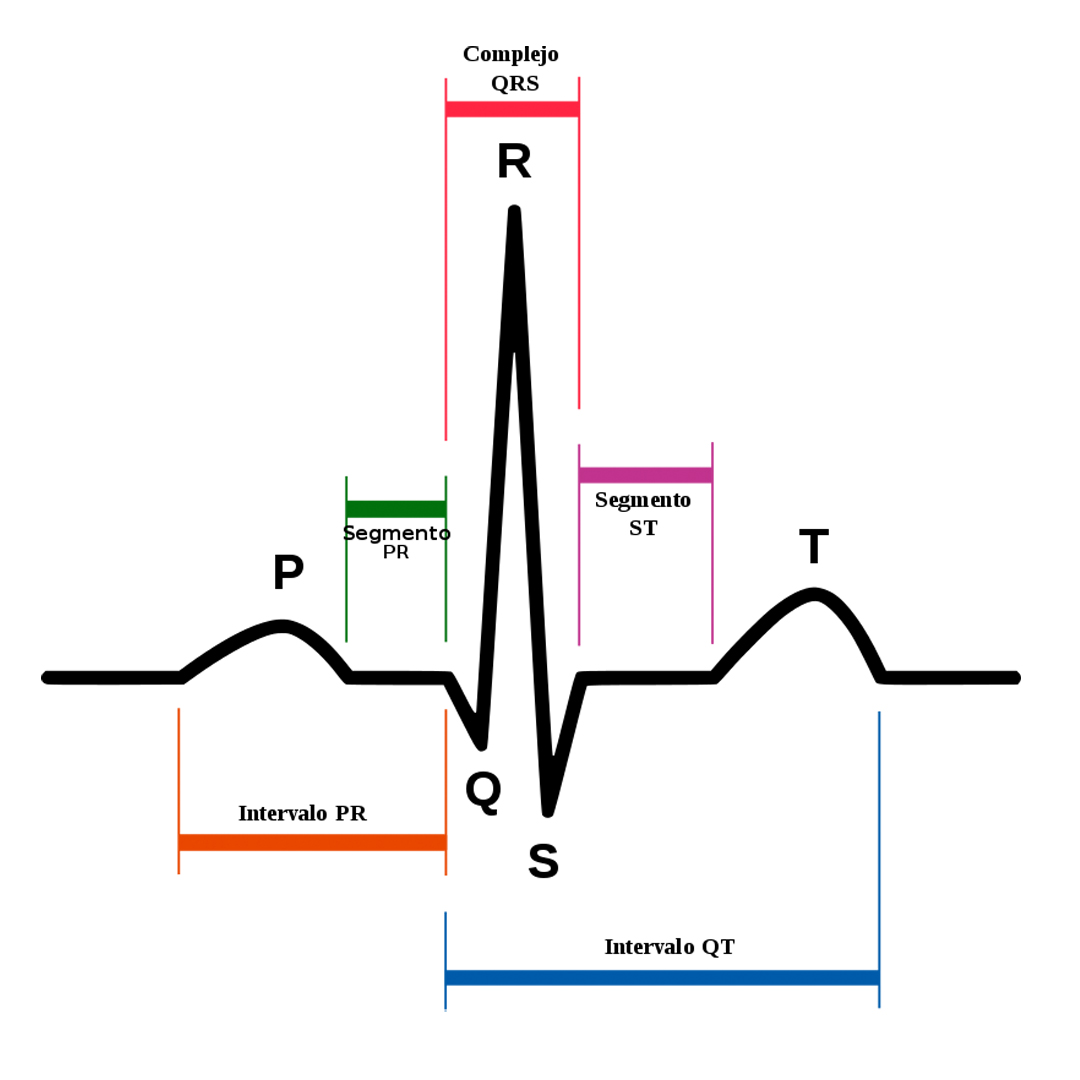
The ECG provides mainly two types of information (2):
- Time interval measurement: allows determining the time it takes for the electrical wave to pass from one part of the heart to the next. This helps to assess whether the electrical activity is normal, slow, fast or irregular.
- Measurement of the amount of electrical activity in the heart muscle: reveals if there are parts of the heart with large size or high blood volume load.
In addition, some alterations in the electrocardiographic tracing may indicate specific cardiac alterations, water and electrolyte imbalances, intoxications or other disorders.
To whom should it be made?
Electrocardiography is routinely performed either as part of screening, prior to certain surgical procedures or for the diagnosis and follow-up of cardiac conditions or chronic diseases (5).
How is the electrocardiogram performed?
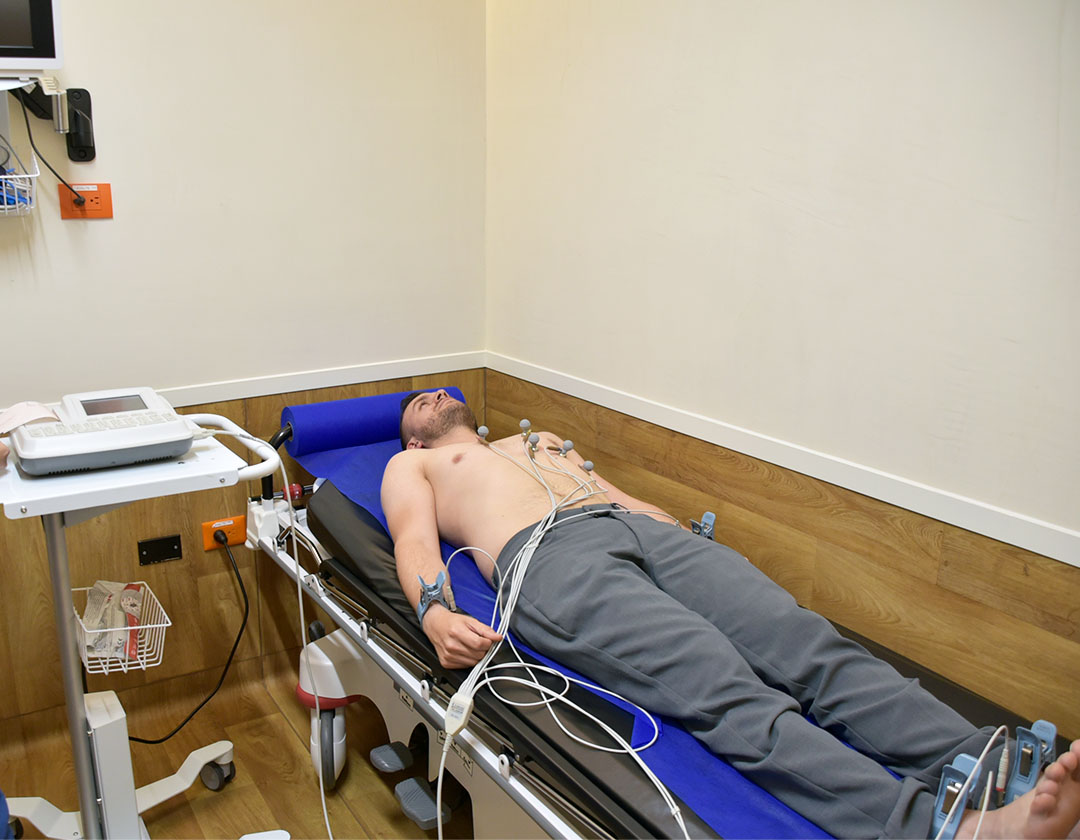
Medical personnel attach the electrodes to the patient's skin by means of adhesives or suction cups, which are connected to the electrocardiograph cables. These electrodes are placed on the ankles, wrists and chest, allowing the same electrical impulse to be captured from different positions (4,6).
Before placing the electrodes, the skin area is cleaned and, in some cases, it will be necessary to remove the hair in the area. Once the equipment is turned on, the tracing of the 12 or more leads is performed, depending on the needs of each patient (4).
The quality of the tracing is then checked to ensure that it is of adequate quality for reading and interpretation. The electrodes are removed from the patient and the skin is cleaned. Finally, the cardiologist performs the reading of the electrocardiographic tracing; in our case, within a maximum of 24 hours.
Ambulatory electrocardiographic monitoring or HOLTER
Ambulatory recording of the ambulatory electrocardiogram, also known as Holter, is a system that allows the recording, visualization and analysis of the ECG of an individual in motion. Current Holter systems are portable and do not interfere with the patient's daily activities, which facilitates obtaining a complete electrical recording with high tracing quality (7-9).
The modality most commonly used in clinical practice is continuous recording for 24 or 48 hours. To carry out this process, a basic set of equipment is required (7,9):
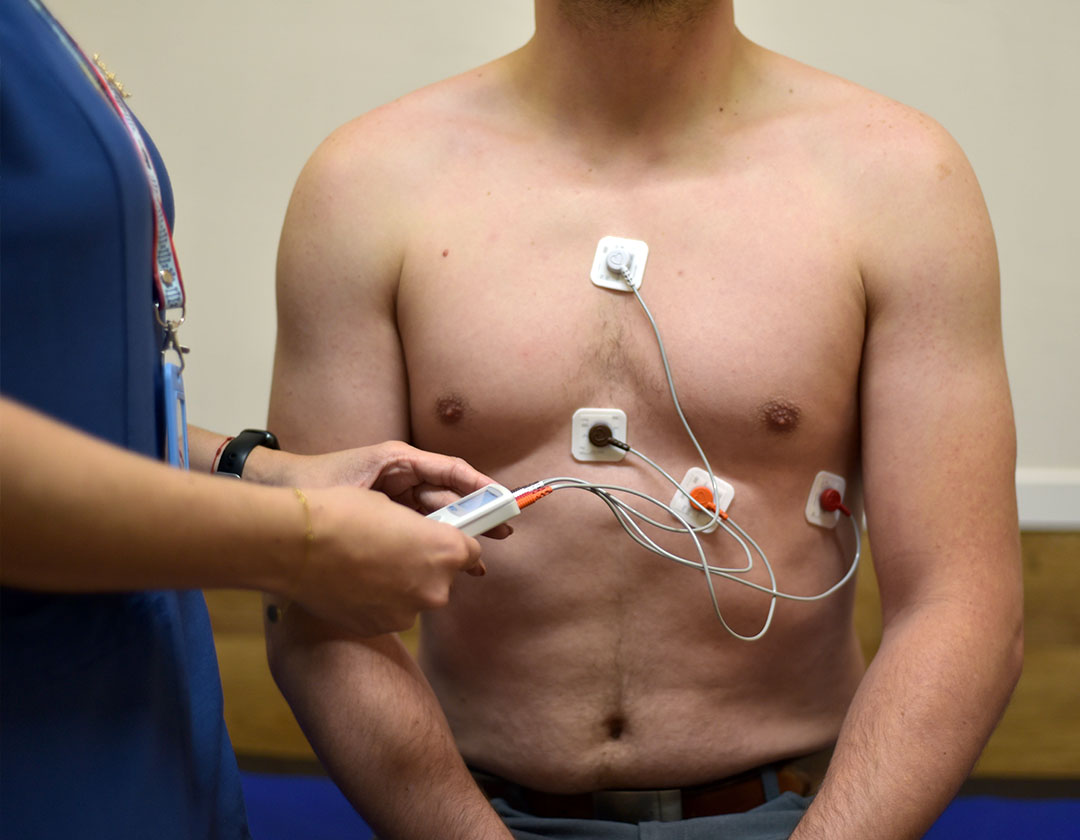
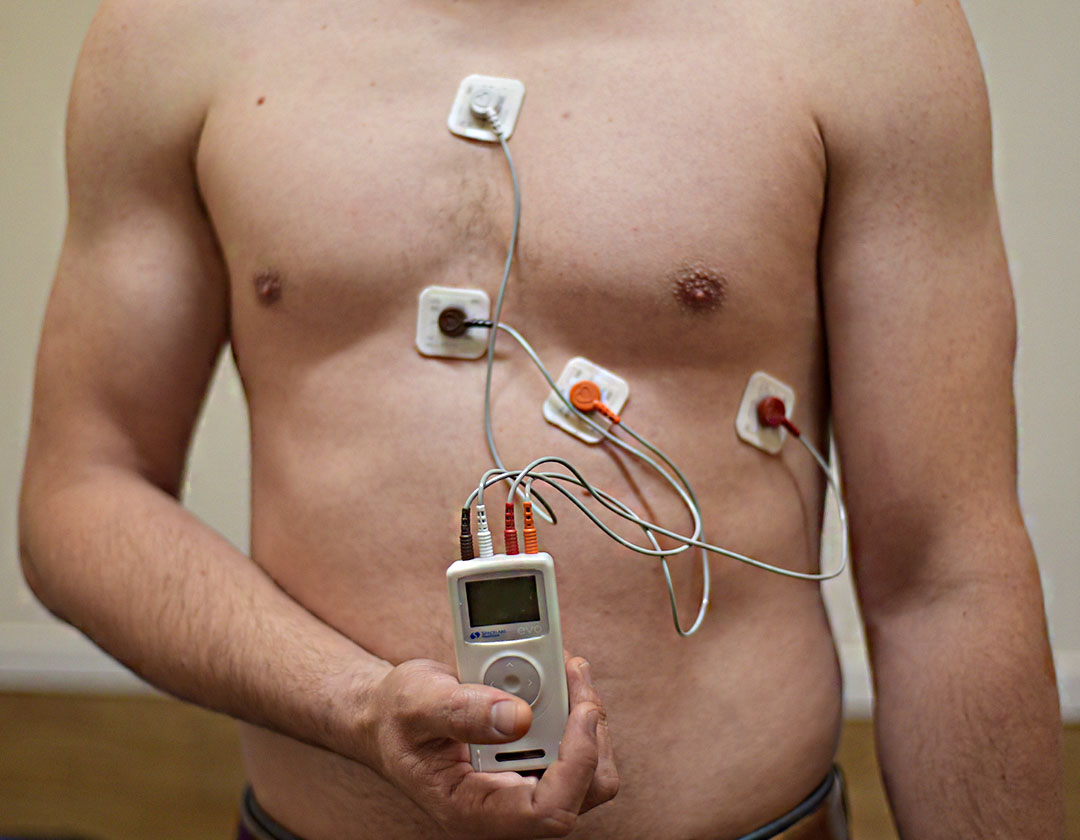
Electrodes: they are adhered to the skin by means of plasticized adhesive discs. It is important to meticulously prepare the skin areas, removing hair if present and cleaning with alcohol. To obtain a better electrocardiographic tracing, the electrodes should be placed on bony planes. After placement, the wires are connected to each electrode, and the first 8 to 12 cm of the wire is collected in a loop, which is also fixed to the skin to avoid sudden movements that could damage the tracing.
Digital recorder: it has an integrated clock and power supply. It is small and lightweight (less than 250 g), which provides greater patient comfort and allows recording even during exercise. Current equipment meets the minimum requirements established by the American Heart Association for ST-segment analysis, including the ability to adequately analyze high and low frequency signals in the range of 0.05 Hz to 100 Hz.
Electrocardioanalyzers: they have an automatic analysis system that classifies the tracing of cardiac waves according to their shape and voltage. In addition, it provides a report that includes the following parameters:
Heart rate: total QRS complexes and maximum and minimum heart rate, hourly and 24-hourly, presented as a frequency trend, histogram or numerical values.
ST segment analysis: ST segment alterations in 24 hours and quantification of its rise or fall in millimeters.
Ventricular arrhythmias: detects, quantifies and classifies ventricular arrhythmias (e.g. isolated ventricular extrasystoles, paired ventricular extrasystoles and tachycardia bursts) displaying the information as a histogram or numerical values.
These devices also allow the reproduction of electrocardiographic tracings at different paper sizes and speeds.
To whom should it be made?
Holter is used to diagnose and characterize cardiac rhythm disorders (arrhythmias), and correlate them with symptoms such as syncope, dizziness, palpitations, fatigue and chest pain. Currently, it is also used to study myocardial ischemia, both silent and symptomatic (ST-T segment changes), which is especially important in patients unable to perform a stress test. In addition, it is used to evaluate the efficacy of anti-ischemic and antiarrhythmic drugs, and routinely in patients with pacemakers and implanted defibrillators (7).
How is Holter monitoring performed?
As in an electrocardiogram, electrodes are placed on the skin of the patient's chest using adhesives. These electrodes are connected to the recorder that records the events and the recorder is secured to the patient's body as described above (7). After 24 hours, the patient returns to have the equipment removed. The data are downloaded from the recorder by software for analysis and interpretation. Finally, the cardiologist reads and analyzes the electrocardiographic tracing, in our case within 72 hours.
Ambulatory Blood Pressure Monitoring (ABPM)
Ambulatory blood pressure monitoring (ABPM) is a test that allows continuous measurement of a patient's blood pressure outside the medical-hospital setting, and usually for 24 hours ( 7,10). It is currently considered the most accurate technique for the precise diagnosis of arterial hypertension (AHT) and for evaluating the efficacy of antihypertensive drugs. Therefore, its use has become routine in most cardiology services and hypertension units (7).
To whom should it be made?
The indications for the use of ABPM, according to the seventh report of the Joint National Committee on Prevention, Detection, Evaluation, and Treatment of High Blood Pressure (JNC-VII) of the United States, are as follows (7,11):
- Suspected "white coat" hypertension, which refers to the patient's blood pressure rising in a medical setting.
- Evaluation of the effect or resistance to drugs with an effect on blood pressure.
- Evaluation of the blood pressure pattern during sleep, especially in cases of "non-dippers" (absence of nocturnal blood pressure drop).
- Analysis of episodic arterial hypertension, as in cases of pheochromocytoma.
- Evaluation of hypotension associated with antihypertensive therapy.
- Investigation of dizziness or fainting of unknown origin that could be related to sinus node disease or pacemaker dysfunction, among others.
- Evaluation of the effect of antihypertensives in clinical research trials.
How is the MAPA performed?
The MAPA procedure involves the placement of an insufflatable cuff on the patient, which is connected to a digital recorder. The recorder is programmed to inflate and deflate the cuff at specific intervals during the day and night. Before inflating the cuff, it emits a signal. Once the required pressure has been achieved, it starts deflating slowly. During this phase, it is important that the arm is kept at rest and extended (7,10).
After completing the 24-hour recording period, the patient returns to the medical service to have the device removed and the data transferred to the corresponding software ( 10). This data will be interpreted by a medical specialist, in our case within 48 hours at the latest.
**
At Enlace Clínico del Laboratorio Clínico Hematológico, we have a Cardiodiagnosis Unit, led by Dr. Gustavo Restrepo Molina, a cardiologist and echographer of the city and supported by a highly qualified medical and nursing team committed to providing humanized and personalized care.
We invite you to make use of our services of high quality cardiodiagnostic aids in the city of Medellin, Colombia. To schedule an appointment, you can contact us by phone at 604 44 44 200 or through our WhatsApp line at +57 311 7497048. We will be happy to assist you and offer you the care you deserve.
Bibliography
- Hansen JT, Netter FH, editors. Netter's clinical anatomy. 4th edition. Philadelphia, PA: Elsevier; 2014. 588 p.
- American Heart Association. Electrocardiogram (ECG or EKG) [Internet]. 2023 [cited 2023 Jul 4]. Available from: https://www.goredforwomen.org/es/health-topics/heart-attack/diagnosing-a-heart-attack/electrocardiogram-ecg-or-ekg
- Zavala-Villeda J. Description of the normal electrocardiogram and electrocardiogram reading. Rev Mex Anest. 2017;40(Suppl 1):210-3.
- Spanish Heart Foundation. Electrocardiogram [Internet]. 2023 [cited 2023 July 4]. Available from: https://fundaciondelcorazon.com/informacion-para-pacientes/metodos-diagnosticos/electrocardiograma.html
- Watson Hernandez RA. Interpretation of the normal electrocardiogram: electrocardiogram. Rev Cienc Salud Integrando Conoc. October 21, 2022;6(5):85-91.
- García Velarte M, Barcelona Blasco C, García García García LR, Millán Duarte Y, García Sacramento AC, Garcés Fuertes P. The role of nursing in the adequate performance of the electrocardiogram. A monographic article. Rev Sanit Investig. 2021;2(11).
- Palma Gámiz JL, Arribas Jiménez A, González Juanatey JR, Marín Huerta E, Simarro Martín-Ambrosio E. Clinical practice guidelines of the Spanish Society of Cardiology in ambulatory electrocardiogram and blood pressure monitoring. Rev Esp Cardiol. 2000;53(1):91-109.
- Villegas-García M, Carrillo-Mora LM, Tovar MM. When to indicate the practice of a holter. FMC - Form Médica Contin En Aten Primaria. March 2023;30(3):127-31.
- Steinberg JS, Varma N, Cygankiewicz I, Aziz P, Balsam P, Baranchuk A, et al. 2017 ISHNE-HRS expert consensus statement on ambulatory ECG and external cardiac monitoring/telemetry. Heart Rhythm. july 2017;14(7):e55-96.
- Rodriguez Escobar T, Sellén Sanchén E. Usefulness of ambulatory blood pressure monitoring in clinical practice. Progaleno. 2019.a-07-15.a ed. 2019;2(2):13.
- Chobanian AV, Bakris GL, Black HR, Cushman WC, Green LA, Izzo JLJ, et al. Seventh report of the Joint National Committee on Prevention, Detection, Evaluation, and Treatment of High Blood Pressure. Hypertens Dallas Tex 1979. December 2003;42(6):1206-52.